Welcome to another edition of What just happened with those referendum results?!
- There’s a lot of data. In fact, there have never been more referendums during one school year than there were this year.
- While we’ll dig into April 2025 specifically in just a few moments, remember that our annual analysis runs by school year. Why? It better follows both the school district financial and state budgeting cycles. School financial calendars run from July 1st to June 30th. Thus, for us, a referendum that happens in August is part of the upcoming school year data.
- We’ll spend some time talking about capital, non-recurring, and recurring referendums. Capital referendums ask voters to help pay for facility updates through a bond (kind of like a mortgage loan). Operational referendums can come in non-recurring and recurring varieties. Non-recurring referendums ask voters to provide additional funding for daily operations for a set period of time (often three to five years). Recurring referendums do not expire after a set number of years.
Okay. Let’s get to it.
Takeaway 1: A higher proportion of referendums passed this school year than last school year—but not because of April.
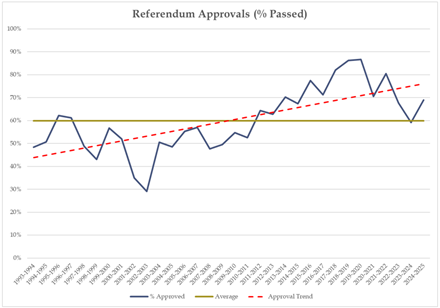
Voters approved 69% of referendums (160/232) they saw during that time. That’s an approval rate 10 percentage points higher than last year (61/103). As we said above, that’s 69% of a lot of referendums—232 to be exact. This is the most we’ve ever seen in one year; it squeaked by 1997-1998, when there were 230 on ballots.
That 69% is also above the 32-year average. (Why 32 years? Because in 1993-1994, the state instituted revenue limits, which spurred much of what we’re experiencing today).
This school year’s relatively high percentage of approvals stems from the November presidential election. Then, voters approved 78% of referendums (107/137). In April 2025, voters approved 55% of referendums (49/89).
Takeaway 2: Whether a 69% approval rate is “normal” depends on your timeframe.
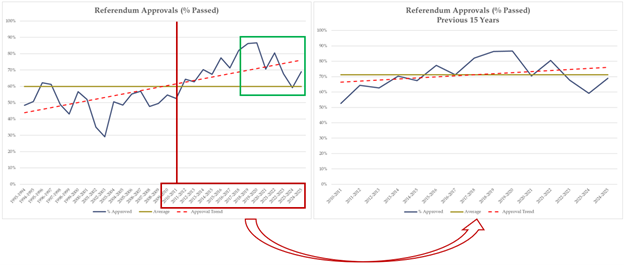
In any given year, about 60% of referendums are approved by voters. That makes this year above average. However, if your frame of reference is the last 15 years, this year was nothin’ to write home about. In fact, using that timeframe, voters approve approximately 72% of referendums they see on ballots. That would make this year below average. There’s no right answer here.
Take a look at the image below. There’s a lot going on here, but we’ll make sense of it.
- Why is 15 years a reasonable timeframe for recent comparisons? Because that’s the year (2010-2011) that the Wisconsin legislature approved Act 10. Look at the percentage of referendums voters approved to the left of the red line. Then, look how much more enthusiastic voters became for referendums to the right of the red line. That school year was a turning point in referendum history in Wisconsin.
- Next, I took the 15 years highlighted in the red box (the most recent 15) and made a graph only for that frame (that’s the graph on the right). You can see how the last few school years have shaken out. The last three years have had a lower proportion of referendum approvals than what many districts experienced in the mid- to late 2010s.
- Finally, take a look at the green box in the left graph. Big picture, the percentage of referendums approved by voters is trending down. Yes, there are a few bumps along the way (including this school year), but we’re not seeing the sky-high 86-87% approval rates we saw in years past.
Takeaway 3: This April was lower than recent Aprils.
Typically, voters approve a greater proportion of referendums in April than what they did just a few days ago.
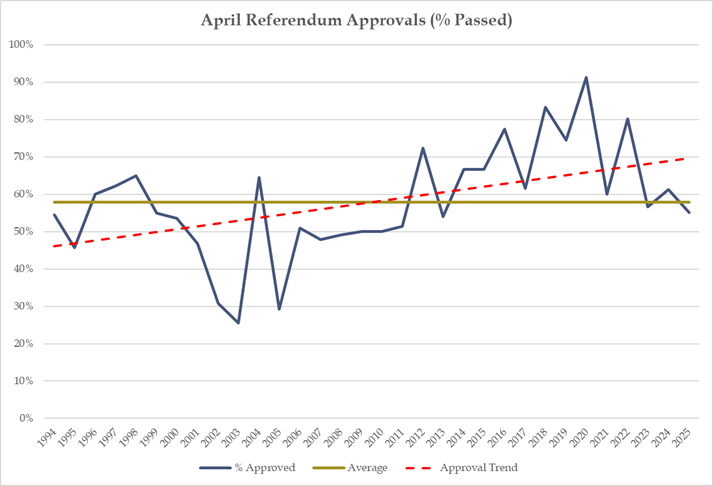
More specifically, 55% were approved on April 1. On average, voters approve approximately 58% of April referendums. Over the past 15 years, voters approved 67% of April referendums. (Catching a pattern here?) Over the last 10 years, voters approved 70% of April referendums.
Kind of relatedly, the correlation between turnout and the percentage of referendums approved by voters seems to hold. You can see this in the table below.
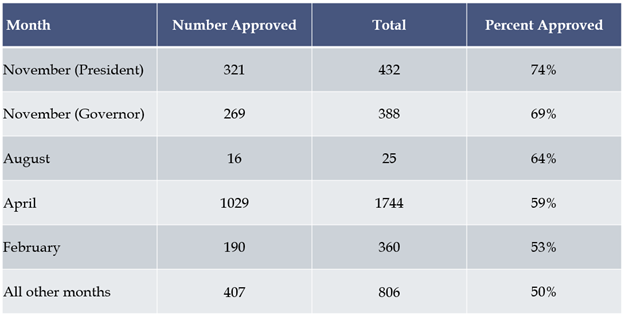
It’s true that August (a low-turnout month) is higher than April (a middle-of-the-road-turnout month). However, take a look at the denominators. August makes up just 0.67% of all referendums held since 1993. April makes accounts for 46%.
Takeaway 4: The results for many referendums were remarkably close.
School districts need 50% + 1 voter for approval. For many, they didn’t get much more (and for many others, I suppose, they weren’t too far away). Of the 232 referendums this year, 51 of them had support in the 48 to 52% range. Over one-quarter of the referendums on the ballot in April were in the 48 to 52% range.
Here’s another way of saying something similar: the referendums that passed did so with a less comfortable margin. Over the last 10 years, referendums that pass garnered an average of 60% support. In April, referendums that passed had about 55% support. During that same time, referendums that failed had an average of 43% of voters in support. In April, it was 45%.
Translation: It wouldn’t have taken too many votes to change a pass into failure and vice versa.
Takeaway 5: There’s a new record for the amount of money requested by schools, and it’s this year.
The amount of money voters are seeing on their ballots is difficult to fathom. Across the four election opportunities this school year, 184 school districts requested $6.07 billion from local taxpayers. That beats the $3.5 billion requested in 2022-2023.
To put that into context, the total state education support during fiscal year 2025 was $8.5 billion (source). That means that 44% of school districts asked for the equivalent of 71% of what the state aids all school districts.
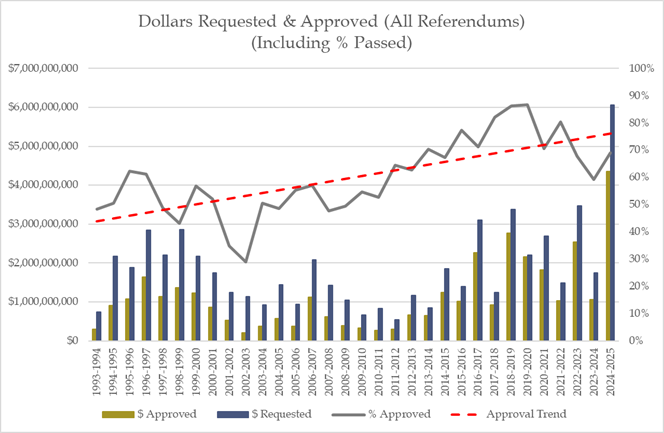
You can see this visually in the accompanying graph. The yellowish bar is higher than any other blue bar.
Takeaway 6: Voters approve more capital than operational referendums.
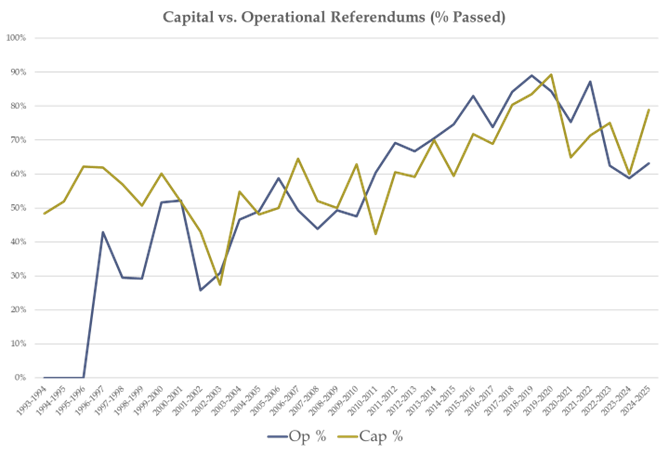
Remember: capital referendums fund building improvements (new buildings, additions, renovations, etc.), and operational referendums fund, well, just that—daily operations (staffing, transportation, utilities, curriculum updates, etc.).
Let’s revisit our now-familiar 15-year timeframe. Between the 2010-2011 school year and the 2021-2022 school year, voters approved a higher proportion of operational referendums than capital referendums in every year but one. In the past three school years, voters have preferred capital referendums. This year, voters approved almost 80% of capital referendums on their ballots. They approved about 63% of operational referendums.
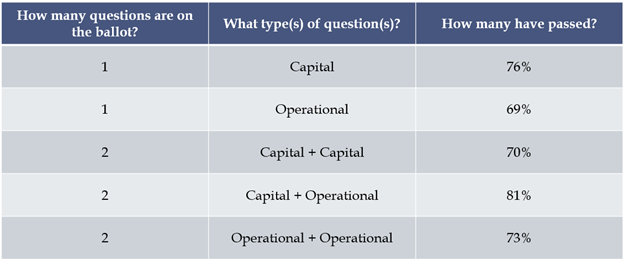
Takeaway 7: Two questions maybe aren’t harder to pass than one? Or maybe they are?
The more “academic” way of posing this question would be, “Is a referendum less likely to be approved if it ‘competes’ with another referendum on the same ballot?”
Since September 2017, Wisconsin school districts have been limited to two referendum questions per calendar year, regardless of what kind. Thus, a district could do two capital questions, a capital and an operational question, or two operational questions. Or, of course, a district could always ask one question. Let’s go through each of these.
Honestly, this one really kinda shocked us and might take some more nuance than what we have room for here.
Fewer operational referendums have passed than capital referendums; that we covered above. Passing two capital questions at the same time is harder than passing one. That’s pretty sensible.
However, 81% of questions have passed when they compete with the “other” kind of referendum. There are a few reasons why this might be the case.
First, the questions are often paired, e.g., building a pool (capital) and operating the pool (operational). When one goes down, the other goes down with it. Thus, if I like the project, I like both questions. If I don’t, I don’t like both questions. Voters still see them as a package.
Second, you’re likely to make each question cheaper if you know it has to compete. In other words, if you were planning to ask for, say, $50 million in capital improvements, but you then determine you also need an operational referendum, maybe you lower the ask to a more palatable $20 million.
Third, you might split the yes-vote in two, but there might be just enough double-yes voters to get them both over the finish line. Take this fictional but realistic example. Maybe if a district had put a single $50 million question on the ballot, it would have garnered 60% support. Maybe if that same district put a single $10 million operational referendum on the ballot, it would have garnered 58% support. Now, that same district puts both on the ballot. Some people can’t afford both. So, they choose one, and each garners 51% support. Sure, both pass, but it’s a much bigger gamble.
There a lot of variables here, so I would put this in the “jury’s still out category.” But it’s worth collecting more data about.
If you have questions you’d like us to dig into, let us know! We can be reached at research@schoolperceptions.com.
The School Perceptions Blog and Resource Center features the voices of our team members. This post was written by Rob DeMeuse, Vice President of Research, and Scott Girard, Project Manager.