This next set of posts, the second in our six-part research series, will answer three questions:
- What factors matter most when you want to retain your best staff?
- What factors matter most when you want to ensure parents are highly satisfied?
- What factors matter most when you want to ensure students are highly engaged?
Beginning in October, we’ll feature concrete steps you can take to improve on these factors with lessons and tactics from both school district administrators and peer-reviewed research.
Earlier in September, we discussed which staff survey items scored the highest and lowest and which items increased and decreased the most year-over-year. (If you missed that one, start here.)
When we present data like that to a school district, we almost always hear, “This is really valuable. Where should we begin? What should we fix first?”
This blog answers that for you as it relates to staff.
What if you don’t have enough money?
We’re going to assume that you’d really like to keep your best, brightest, most-effective staff. (Bold claim, I know…)
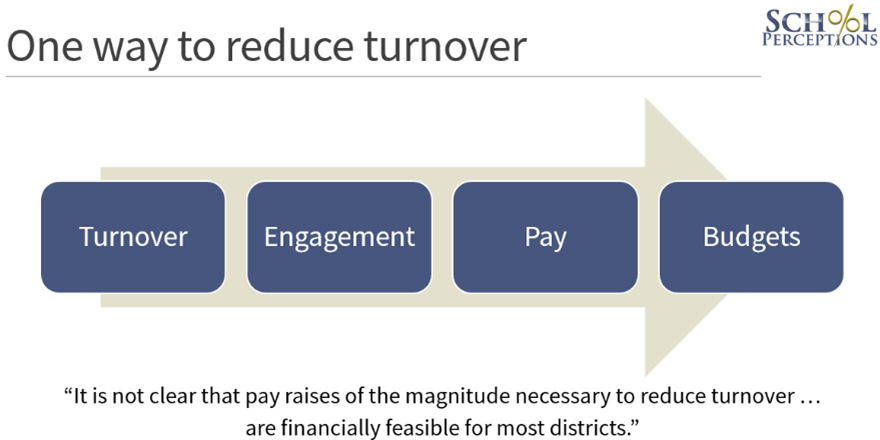
To reduce turnover, you need to improve staff engagement. You can do that with pay. If you increase salaries enough, you will improve engagement scores. However, we’re pretty darn confident you don’t have enough money in your budget to do that. (If you did, you would.) One researcher put it this way, “It is not clear that pay raises of the magnitude necessary to reduce turnover … are financially feasible for most districts” (Grissom, 2011).
Thus, you’re likely going to need to rely on a few other things besides compensation to improve engagement.
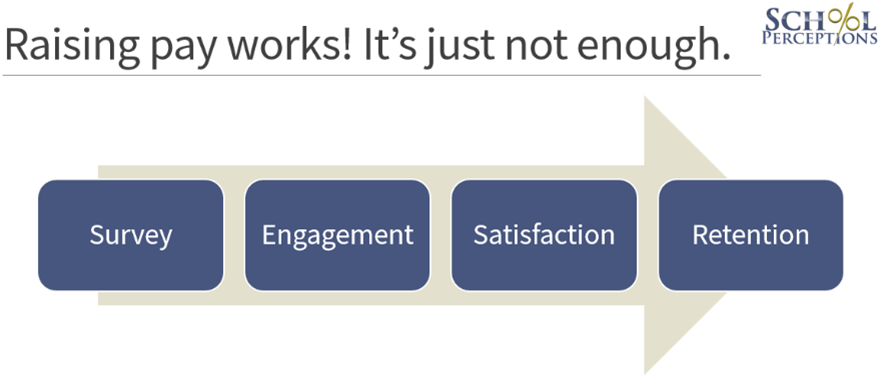
That’s where perceptions data comes in. Our surveys help you measure a manageable number of specific items that quantify a great deal more than just pay.
More specifically, perceptions data measures how engaged your employees are. Engagement can be defined in multiple ways, but we have a few favorites:
- Amount of discretionary effort.
- Energy, involvement, and efficacy.
- What employees think and feel about work.
More engaged employees are more satisfied employees. (In other words, engagement is a satisfaction antecedent; you can’t be satisfied if you’re not engaged.)
Satisfied employees are more committed and less likely to withdraw; they are inclined to “go the extra mile”; and enjoy more positive attitudes and intentions. Once satisfaction increases, your ability to attract and retain staff improves. In fact, staff will be willing to recruit and act as an ambassador on your behalf.
Our surveys don’t explicitly ask, “Are you an effective employee who’s planning to leave?” That’d be a strange question. It’s pretty darn direct, but you’re not going to get good data. You’d hear something like, “Of course I’m effective,” and either, “I don’t know” or “It’s none of your business what I’m thinking right now.”
So, we need to get an answer to that question when we can’t explicitly ask.
Thus, instead, we ask, “On a scale of 0 – 10, how likely are you to recommend the District as a place of employment?” The higher this score, the less likely you are to lose staff, and this relationship is strongly statistically significant. (Credit to the Wisconsin Policy Forum here for compiling long-term staff turnover statistics based on DPI data.)
What affects whether an employee would recommend your schools and what does not?
At this point, we get to have some fun busting some myths. Pause for a second. Think about all the reasons that might affect whether someone is willing to recommend your schools as a good place to work.
When we ask this question at conferences, we hear things like the following:
- Enrollment (if the school is huge and you barely know kids’ names, it might be a harder place to work?)
- Student-teacher ratio (having 34 kids in my freshman civics class was way harder than when I had 16)
- Achievement (perhaps teaching the high-flyers is perceived to be easier?)
- Salary (who doesn’t want to get paid more?)
- Community wealth (perhaps teaching in a community that’s quite wealthy and I don’t have to worry about whether my kids ate breakfast that day is easier?)
- Locale (is there a perception that small, rural schools are “better” than large urban ones?)
Maybe these affect satisfaction and maybe they don’t, but here’s the problem: you don’t have much (if any) control over these things, especially in the short term. You can’t change the wealth of the broader community. You aren’t going to move your school to the suburbs.
The good news, though, is that these uncontrollable factors only explain about 46% of the “willing to recommend you” variance. That means there are lot of things you can do to improve retention that are very much within your control. (Stats a little rusty? Thinkin’ about the Pack? See the R2 explainer in the box below. Otherwise, skip it!)
|
Variance Explained? Huh?
Let’s say I tell you that I can predict exactly how many touchdown passes Jordan Love) will throw this year and that the only data point I need is the number of hours he practiced this offseason. If I’m correct year after year, I’ve explained 100% of the variance (R2 = 100%). I don’t need to know any other piece of information to make a perfect prediction. Take the other extreme. Maybe practice hours have absolutely nothing to do with how many TDs he throws. In that case, practicing explains 0% of the variance (R2 = 0%). In reality, the time spent practicing is one of many things that affect TD passes. Practice might explain, say, 15% of the variance, but to make near-perfect predictions, I’d want to know a bunch of other things: how good his receivers are, what the weather is for each game, if he (and his receivers) are healthy, how good our opponents are, and so on. The goal is simplicity: get as close to 100% as possible with as few variables as possible. |
What should you fix that is within your control?
This gets us back to our initial question: If you get some scores back that aren’t what you want them to be, what should you fix first to retain as many high-flying staff as you can?
- I feel safe at work.
- Information important to my work is shared with me in a timely and effective manner.
- Staff input is valued.
- I have the materials and supplies I need to do my job well.
- I have opportunities for training/professional development to improve my work.
- I feel supported by my supervisor/administrator when I make a decision.
- I am recognized when I do a good job.
- The amount of work I am asked to do is reasonable/manageable.

Revisiting our R2 metric above, together, the survey items listed above explain nearly 90% of the “willing to recommend” variance. In other words, with just a few questions, we can almost perfectly predict whether someone would recommend your schools as a place to work.
Why do you need to care about that? Because the higher that score, the less turnover you will experience.
|
What’s a “good” R2?
Human behavior is notoriously difficult to predict. We’re complicated creatures. We’re all a little strange, illogical, irrational, and inefficient. Thus, in social science research, if we can explain 50% of the variance (R2 = 0.50), we’re in great shape. The fact that we reached 90% (R2 = 0.90) is thrilling for us nerdy data folks. |
Think about this a little differently. Two of the highest-scoring items from staff were “I have access to the technology support I need.” and “I have the technology I need to do my job well.” That’s great, but the quality of your technology is not going to make or break whether someone stays employed by you. The survey items above will.
Coming up, we’re going to publish some findings related to these factors that matter most. One of our project managers, Scott Girard, will tell you who’s doing great work in these most-impactful areas, and, more importantly, how? What, exactly, are they doing? That’s the practitioner side of things. At the same time, our Senior Research Director, Derek Gottlieb, will couple Scott’s work with what peer-reviewed research is saying about what you need to do to keep your best staff.
The School Perceptions Blog and Resource Center features the voices of our team members. This post was written by Rob DeMeuse, Vice President of Research.